Expensive Calculations
React hooks are amazing. Being able to put all the logic and state management
within a function component allows for mind blowing composability.
This power comes with an unfortunate limitation that calculations performed
within render will be performed every single render, regardless of whether the
inputs for the calculations change. For example:
function Distance({ x, y }) {
	const distance = calculateDistance(x, y)
	return (
		<div>
			The distance between {x} and {y} is {distance}.
		</div>
	)
}
If that component's parent rerenders, or if we add some unrelated state to the
component and trigger a rerender, we'll be calling
calculateDistance every
render which could lead to a performance bottleneck.This is why we have the
useMemo hook from React:function Distance({ x, y }) {
const distance = useMemo(() => calculateDistance(x, y), [x, y])
return (
<div>
The distance between {x} and {y} is {distance}.
</div>
)
}
This allows us to put that calculation behind a function which is only called
when the result actually needs to be re-evaluated (when the dependencies
change). In the example above the array
[x, y] are called "dependencies" and
React knows that so long as those do not change, the result of our function will
be the same as the last time the function was called.useMemo (and its sibling useCallback) is nuanced and should not be applied
in all cases. Read more about this in
When to useMemo and useCallbackMeasuring Performance
To measure performance for a React app, you'll want to simulate a production
user's experience as much as possible. There are two important differences
between what you experience in development and what your users experience in
production which I want to discuss:
- They're running the optimized build of your app
- They're running on less powerful devices
To address, these, you need to make certain your performance measurements
simulate this as much as possible. This means you need to first run the build.
In this exercise, we're using Vite for building our application. You can run
the build in the
playground directory with:npm run build
Then you can run that application with the
preview script:npm run preview
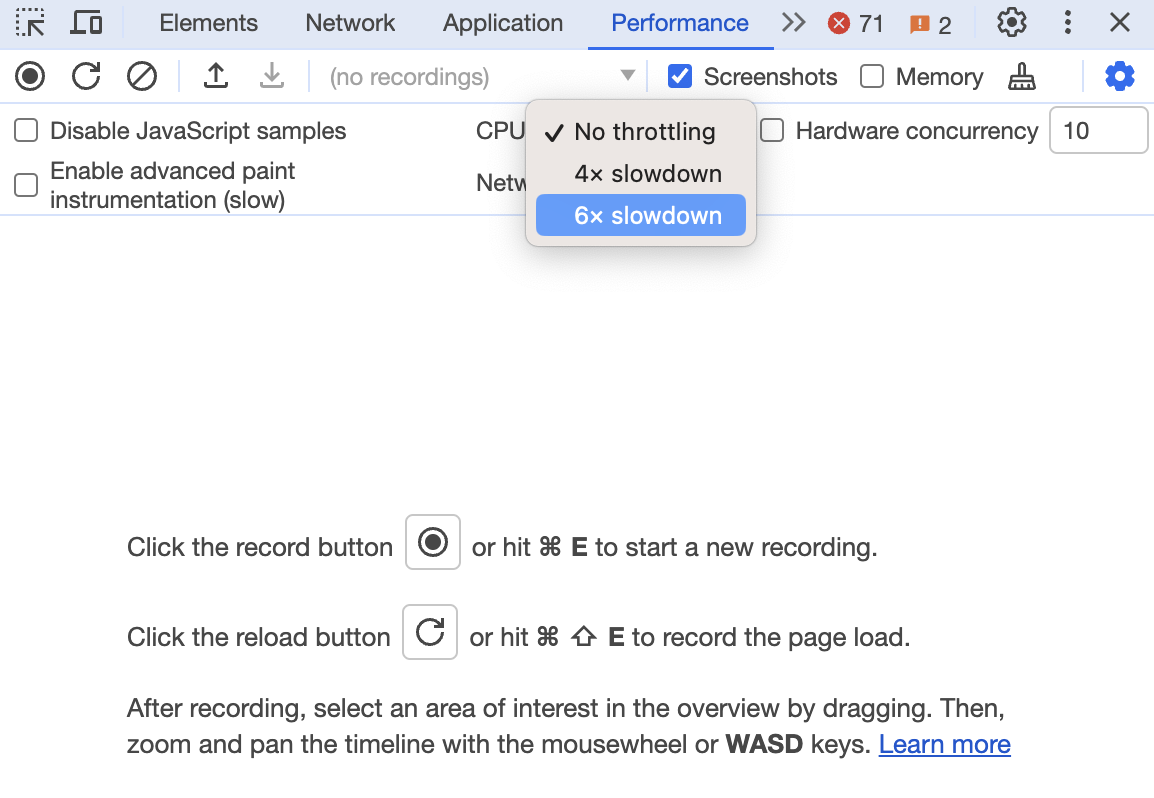
This will allow you to then pull up the DevTools and simulate a slower device
in the performance tab:
From there you can hit "record," perform an operation, then stop and analyze the
resulting flame graph.
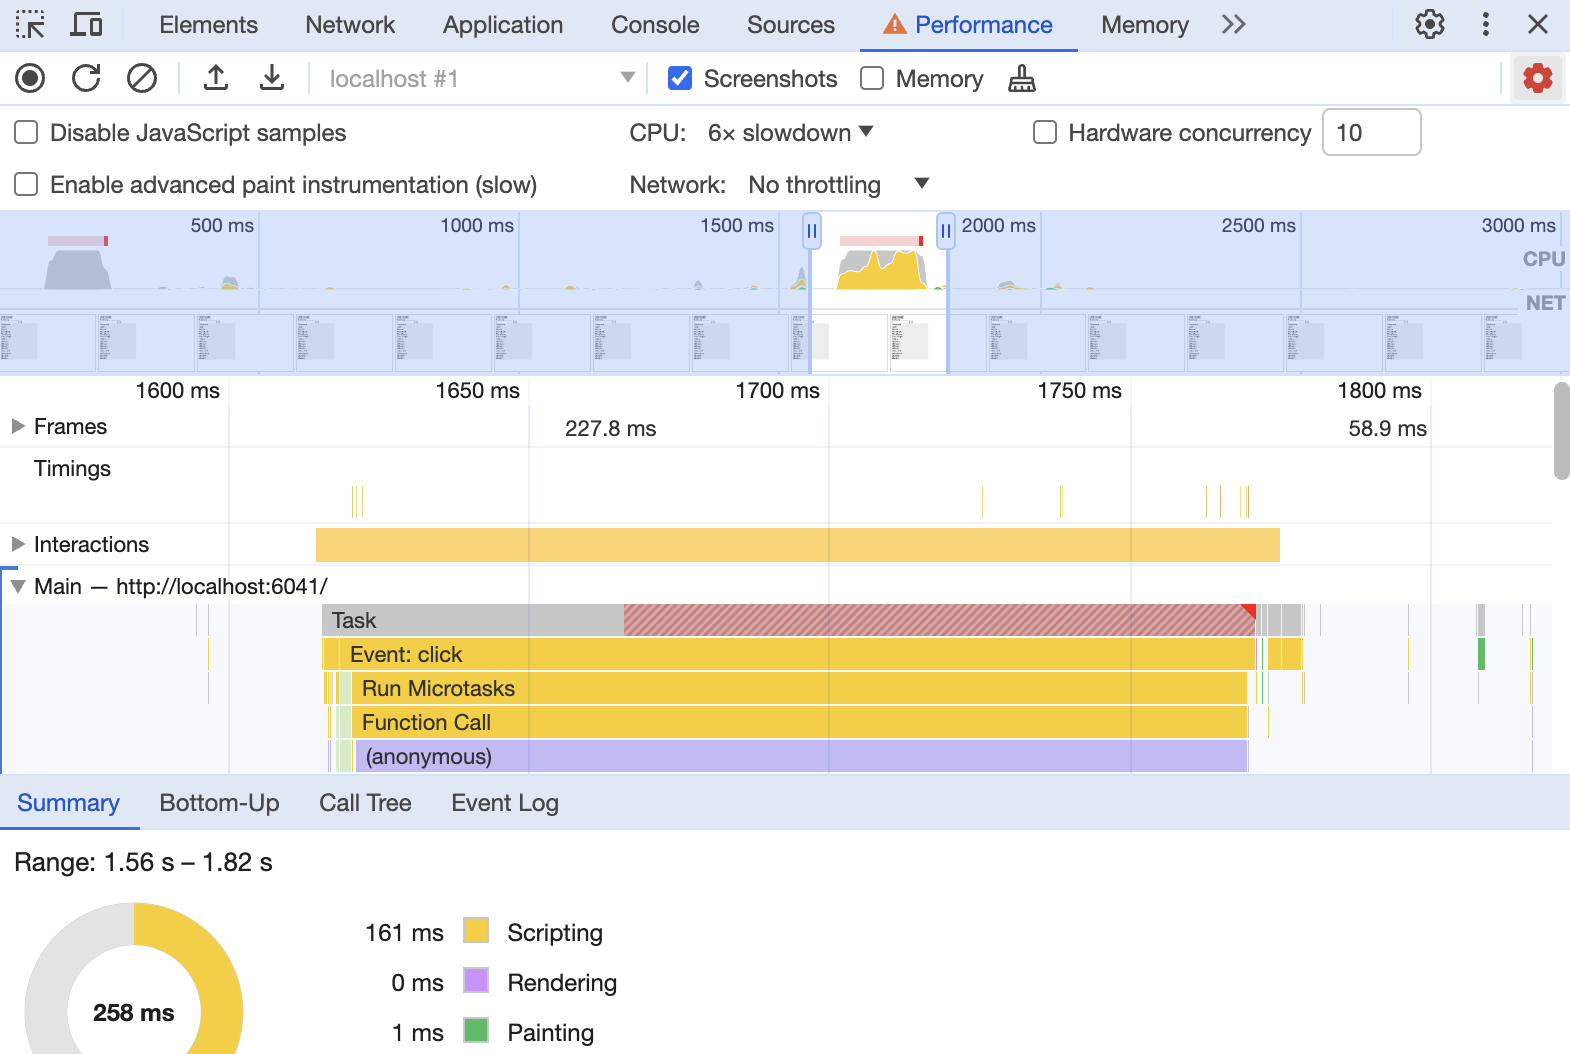
This is a pretty low-level tool, but at the same time very practical. Learning
how to use this tab will help you understand what bottlenecks you should be
optimizing. And whenever you apply a performance optimization, you should be
certain to check the before/after of this flame graph to ensure what you've done
actually improves things.
This tab also takes a lot of practice to get used to (even just navigating
around is tricky). Spend time with it. You'll get it eventually!
To be clear, you don't always have to build the application for production
before you use the flame graph, but you should know that React adds a lot of
development-only code to improve the development experience of using React. So
when you're really trying to get an accurate measure of performance, you'll
want to use the built version.